Bitcoin extended decline and traded below the key $42,000 support zone.
The price is trading below $43,000 and the 100 hourly simple moving average.
There is a key rising channel forming with support near $41,650 on the hourly chart of the BTC/USD pair (data feed from Kraken).
The pair might continue to move down if there is no recovery wave above $43,000.
Bitcoin Price Extends Decline
Bitcoin price started a major decline below the $45,000 and $43,500 support levels. BTC even declined below the $42,000 support zone to move further into a bearish zone.
The price settled below the $43,000 level and the 100 hourly simple moving average. The bears attempted a push towards $40,000. A low was formed near $40,555 before there was a recovery wave. The price recovered above the $42,000 level and the 100 hourly simple moving average.
However, the bears remained active near the $42,800 zone. A high is formed near $42,786 and the price is now declining. There was a move below the 23.6% Fib retracement level of the recent wave from the $40,555 swing low to $42,786 high.
It is now trading near the $41,750 support. The 50% Fib retracement level of the recent wave from the $40,555 swing low to $42,786 high is also near $41,650.
Besides, there is a key rising channel forming with support near $41,650 on the hourly chart of the BTC/USD pair. On the upside, the first major resistance is near the $42,250 level and the 100 hourly SMA. The next major resistance is near the $43,000 level.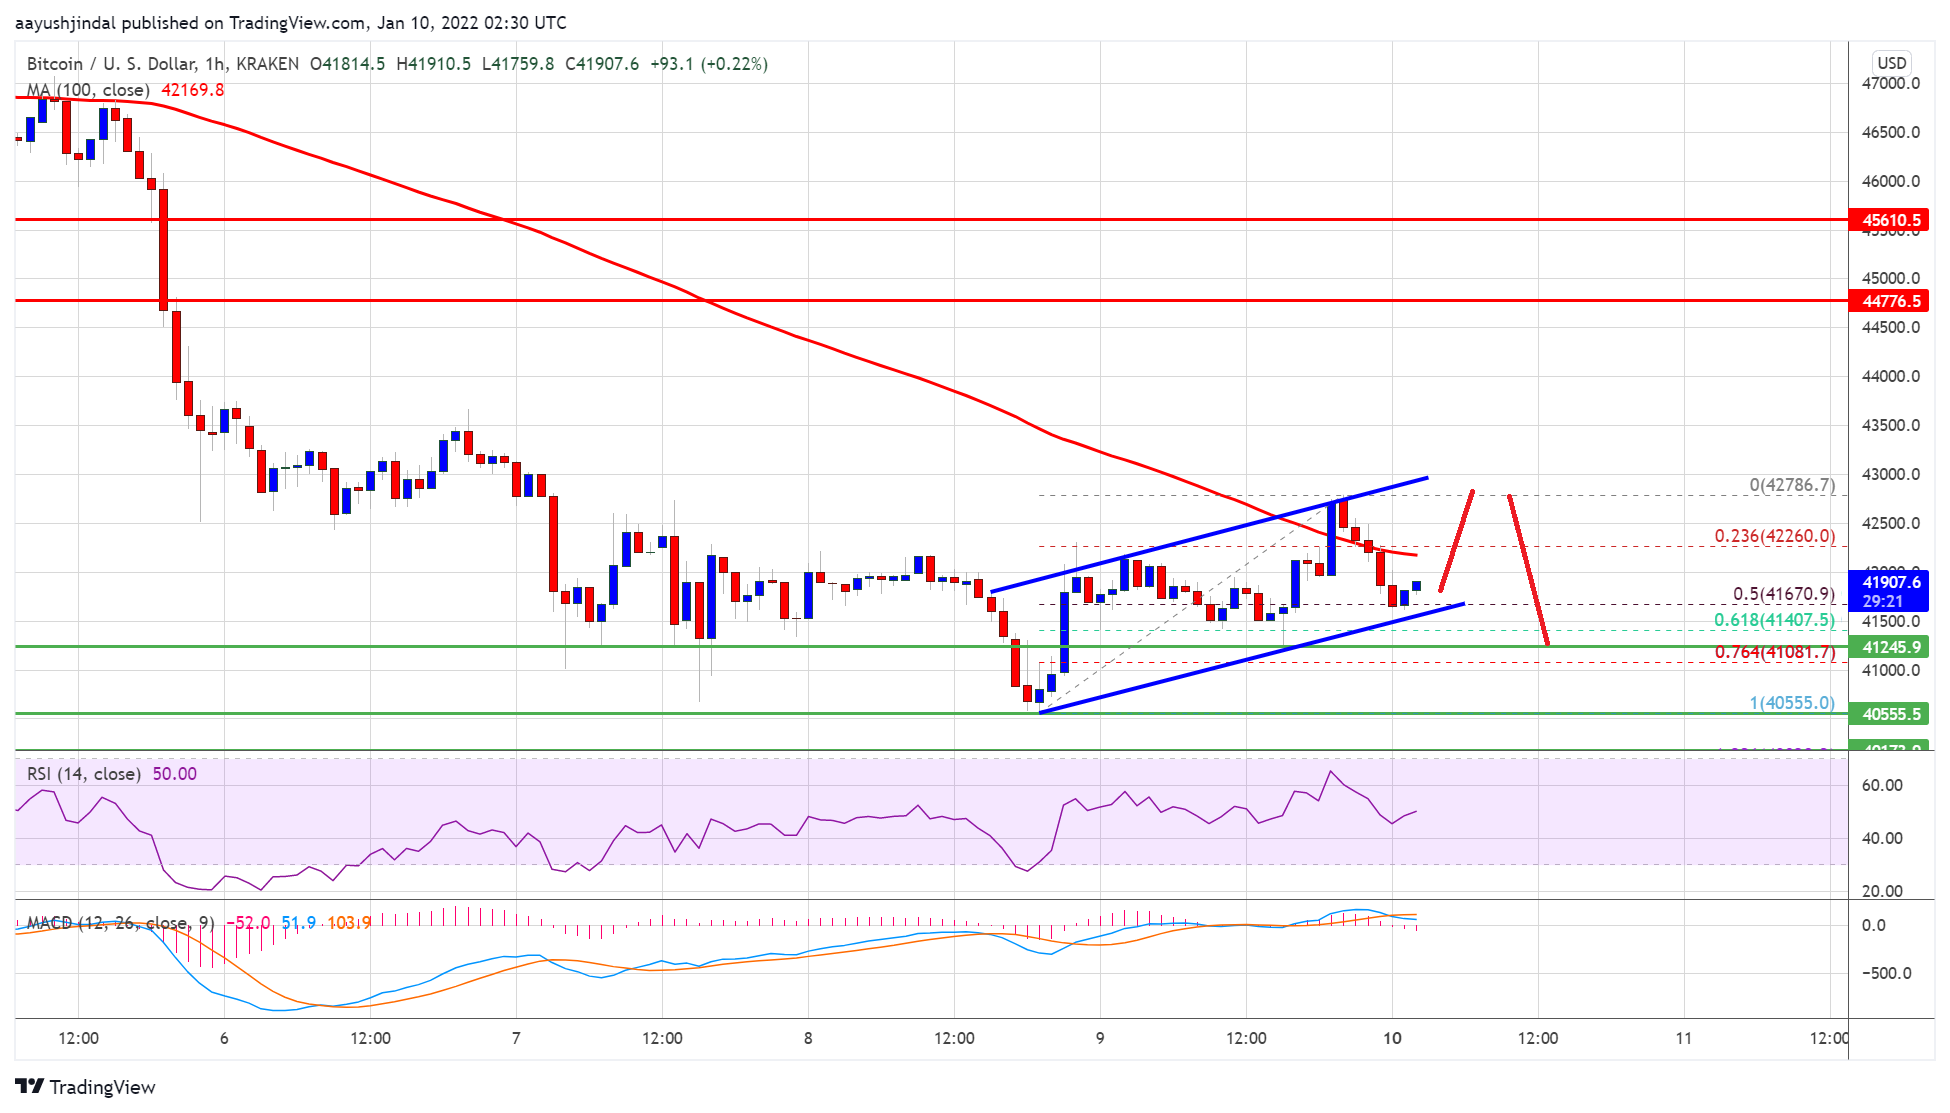
Source: BTCUSD on TradingView.com
A clear move above the $43,000 resistance zone could start a decent recovery wave. The next major resistance is near the $44,500 level.
More Downsides in BTC?
If bitcoin fails to recover above $43,000, it could continue to move down. An immediate support is near the $41,800 zone. The first major support is near $41,650 and the channel trend line.
A downside break below the trend line support could spark a move below $41,000. In the stated case, the price may possibly decline towards the $40,000 level in the near term.
Technical indicators:
Hourly MACD – The MACD is now gaining pace in the bearish zone.
Hourly RSI (Relative Strength Index) – The RSI for BTC/USD is now near the 50 level.
Major Support Levels – $41,650, followed by $40,000.
Major Resistance Levels – $42,750, $43,000 and $44,500.
by Aayush Jindal
Disclaimer : The above empty space does not represent the position of this platform. If the content of the article is not logical or has irregularities, please submit feedback and we will delete or correct it, thank you!
COPYRIGHT © 2021-2025 HZD.COM ALL RIGHTS RESERVED